Standard Data Reporting
Standard Data reporting is powerful, but it requires a special expertise to use it to its full extent. Standard Data leverages the R statistical computing and graphics language. You can create simple charts, tables, and reports or do complex machine learning and data analysis with algorithms.
Due to the learning curve of Standard Data reporting, we provide two ways to get the most out of your data without learning a statistical language:
- Friendly Support - We are data experts at Standard Data. We can help you create custom reports and workflow to make better use of our data.
- General Reports - We create reports that can be useful for any Standard Data client. So far, we have the data overview report and outliers report. You can read more about them below.
Custom Reports
If you need a custom report, please contact us. Based on the level of effort, the report creation may fit within your current contract. We may also create reports at no additional cost if the report is of a general nature that other Standard Data clients can use.
General Reports
Dataset Outliers Report:
Purpose: Used to identify fields values that are potentially incorrect for project managers to review
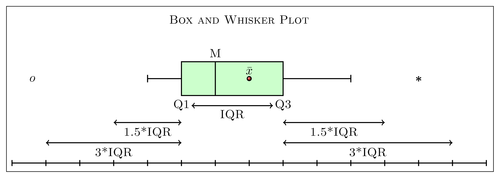
Summary: For any fields that are identified as numeric and linear (as opposed to numeric values representing select options), upper and lower limits are established to define outliers beyond those limits. Reports will be run daily on a project basis by examining all active datasets (have received new records or changes since last report) with at least 1,000 records. Upper and lower limits are determined by using an interquartile multiplier of 3 by default similar to the way extreme outliers are defined in boxplots.
Report Format: The report that is generated will be emailed to project managers and will include a set of unique values identified as outliers and its field name for each dataset in a project.
Data Overview:
Purpose: Offers a high level summary of values in each field for each dataset in a project.
Summary: The summary will depend on the data type for the field. For numeric fields, a histogram displaying the distribution will be shown along with the median, min, max, non-blank count and empty count. For categorical fields (select options used in the form), a bar chart will be displayed along with the most common value and counts for non-blank and empty fields. For String fields, a sample value is shown along with a unique value count and counts for non-blank and empty fields.
Custom R & SQL Report
If you are familiar with R or SQL, you can write your own reports and automate the running of those reports. Documentation on how to do that can be found below, but you may have additional questions that we are happy to answer. As always, we provide ☺ friendly support.
Executing SQL statements:
Purpose: Allow users to run SQL queries that have access to tables within their projects.
Summary: Users can write and execute read-only SQL statements that reference any tables within their projects. The results are returned in HTML format either on demand or scheduled email.
R Markdown Reports:
Purpose: Allow users to upload custom R markdown reports.
Summary: Users can upload custom R reports that have access to any datasets in their projects. Once a report is uploaded, it can run on demand or on schedule and be sent to a predefined set of project users.
Multiple File Support: this allows you to modularize your scripts using separate files as long as the following criteria are met:
- all files must be compressed into a single .zip file (do not use subdirectories).
- a file named report.Rmd must be in the .zip file which will be run first.
-
a separate .css file can be imported if included at the top of the Rmd script
separate R script can be import via the source function.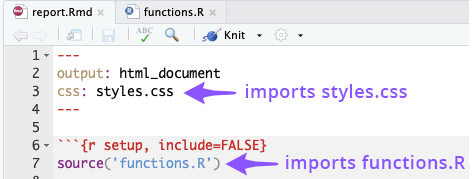
Report Example
This is a basic example of a report that selects all records from a specific table.
  queryResults <- dbSendQuery(con, "select * from table_name_here")
  fetch(queryResults)
- the "con" variable contains database credentials and must be included to query a table
- the sql statement can be modified to any read only statement that references table(s) associated with the project
- the "queryResults" variable is a fuction call that executes the sql statement provided
- the fetch() function converts the values in the queryResults variable to a data frame for viewing
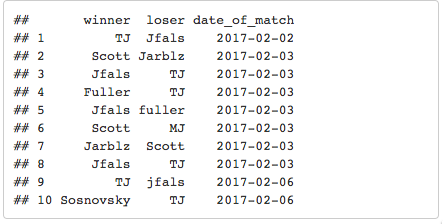
If an R report is uploaded (with a .R file extension), then the following format is expected and the results will be wrapped in an R markdown report for viewing.
Example output:
If an R markdown report is uploaded (with a .Rmd file extension), then an html file of the report output is returned. With this option, you can format the report in any way you see fit, however you MUST include the con variable in order to connect to the database.
Sample Rmd report script:
The con variable must be present to connect to the Standard Data database.
---
title: "R Markdown Example"
output: html_document
---
```
{r message=FALSE, warning=FALSE, echo=FALSE, results='hide'}
library(RMySQL)
library(plyr)
library(ggplot2)
fields <- 'winner'
table.name <- 'ping_pong_matches'
sql.statement <- paste('select', fields, 'from', table.name)
query.results <- dbSendQuery(con, sql.statement)
# retrieve and clean data
dataset <- fetch(query.results, n = -1)
winners <- dataset$winner
winners <- toupper(winners[winners != "\"quote"])
counts <- count(winners)
names(counts) <- c('name', 'wins')
```
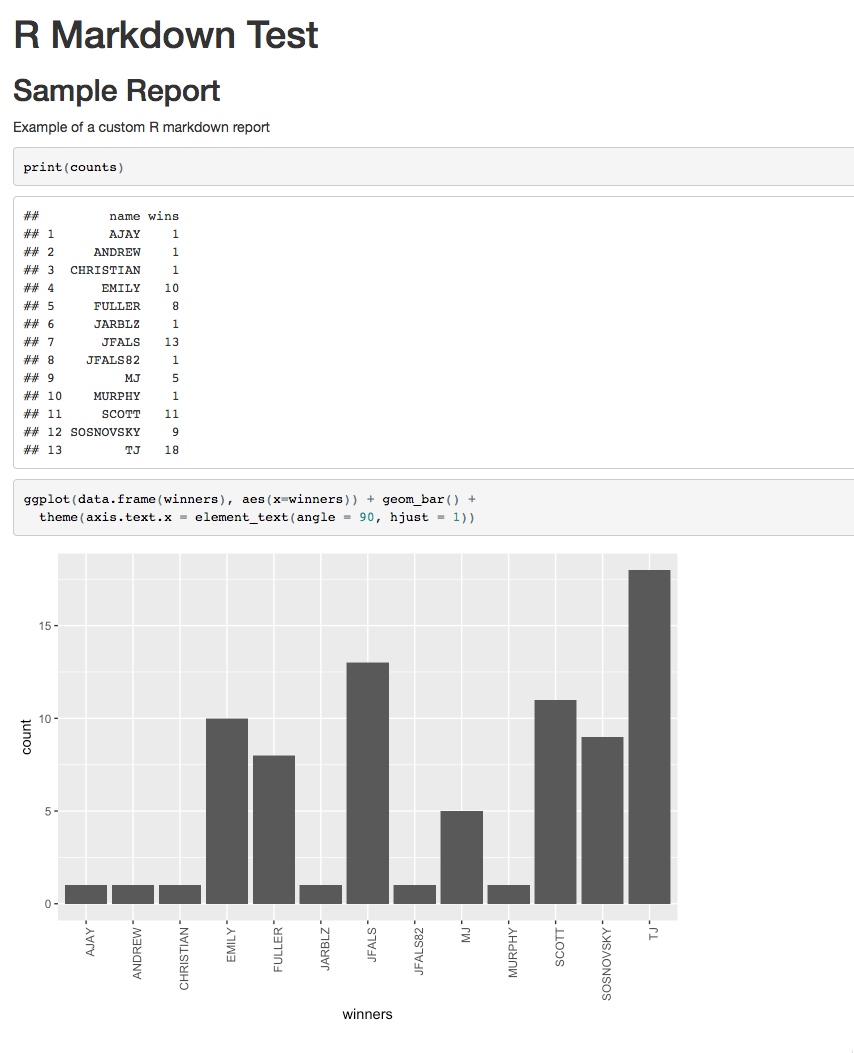
## Sample Report
Example of a custom R markdown report
```
{r}
print(counts)
ggplot(data.frame(winners), aes(x=winners)) + geom_bar() +
theme(axis.text.x = element_text(angle = 90, hjust = 1))
```
Sample Rmd report output:
Report Scheduling:
Purpose: Allow users to control the recipients and timing of scheduled reports.
Summary: After a report is saved, a project admin can configure which project members will receive the report and also which days of the week it will be delivered.
