
We're not just a data collection tool anymore
Once a quarter we bring our core team to Atlanta, Standard Co’s unofficial home (we’re remote but it’s about as central as we get). During that trip home we share what we call a Quarterly Business Review. It’s a forum to share with the team some high level things — our vision, what makes us tick, big wins (and losses), etc.
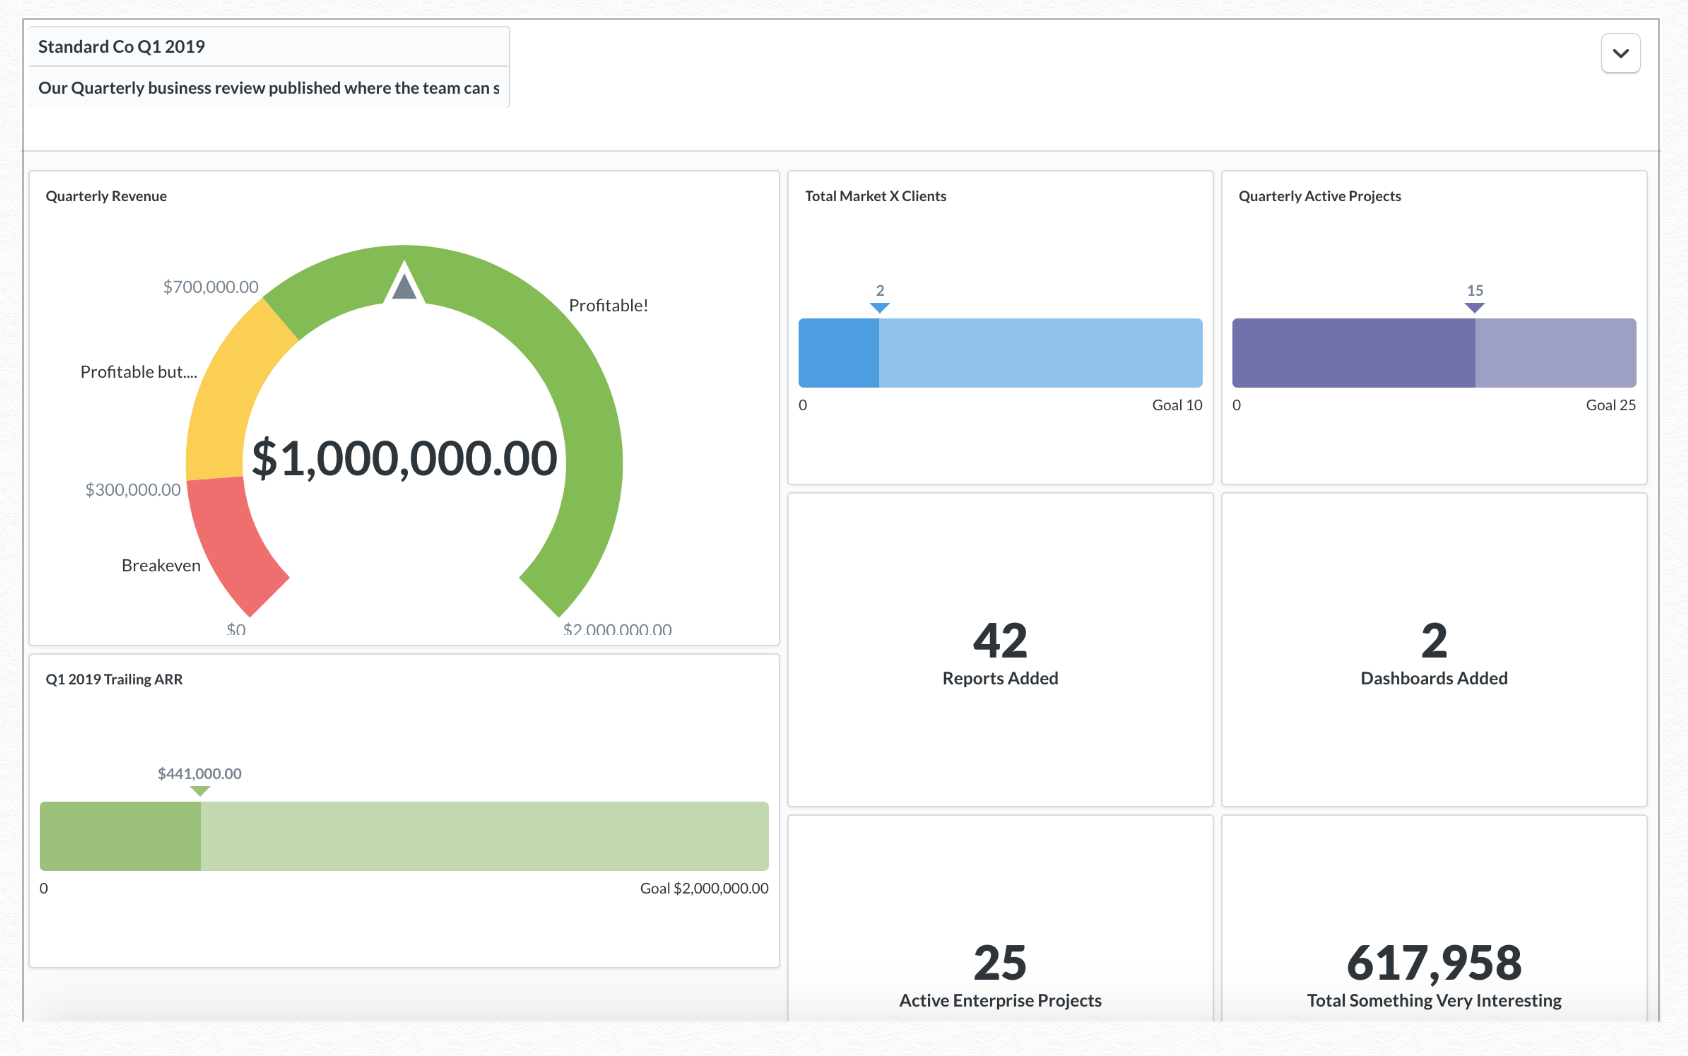
During that review we like to share “by the numbers” stats. We’re a data centric team so knowing quantitatively how we’re doing is pretty clutch to keeping an eye on overall trends. We capture a variety of numbers from a variety of sources: the obvious ones (quarterly revenue), the important ones (trailing ARR — we’re now a product company after all), total number of surveys collected in the last quarter, active customers, customers by market segment, etc.
Since we’re essentially a very fancy database with a multitude of ways to get data into the system (Android, iPhone, website, API) I had no issue getting the data into the system:
The trick was — what to do with that data. It was a mashup of very different datasets from a variety of sources with each system having its own unique dashboard (Intuit has its own, Stripe has its own, etc, etc). Up til very recently, I could create a universal dashboard in SDK but they required lots of configuration and coding. It worked! We used it. Our customers used it. But it wasn’t…easy. For the record, I’m a lazy former programmer so I used to build our dashboards in powerpoint. Shame on me!
That all changed a few months ago when we released a dashboard integration that I think will be a game changer for us. This evening as I sat waiting on my flight I created the dashboard you see below (I sub’d in fake numbers because you’ll have to buy me a beer to see the real dashboard). No coding. No fancy integrations. Just some simple drag and dropping and basic configuring that probably took me 30 minutes. We now have a dashboard that:
Interested in learning more? Drop me a line! tj@standardco.de
During that review we like to share “by the numbers” stats. We’re a data centric team so knowing quantitatively how we’re doing is pretty clutch to keeping an eye on overall trends. We capture a variety of numbers from a variety of sources: the obvious ones (quarterly revenue), the important ones (trailing ARR — we’re now a product company after all), total number of surveys collected in the last quarter, active customers, customers by market segment, etc.
Since we’re essentially a very fancy database with a multitude of ways to get data into the system (Android, iPhone, website, API) I had no issue getting the data into the system:
- Our system accepts CSV uploads to get financial data from Quickbooks in.
- Our team wrote ETL scripts to transform internal metrics into KPIs that we tracked
- I’d manually input some data into a survey we built (from my iPhone or desktop. Both work!)
The trick was — what to do with that data. It was a mashup of very different datasets from a variety of sources with each system having its own unique dashboard (Intuit has its own, Stripe has its own, etc, etc). Up til very recently, I could create a universal dashboard in SDK but they required lots of configuration and coding. It worked! We used it. Our customers used it. But it wasn’t…easy. For the record, I’m a lazy former programmer so I used to build our dashboards in powerpoint. Shame on me!
That all changed a few months ago when we released a dashboard integration that I think will be a game changer for us. This evening as I sat waiting on my flight I created the dashboard you see below (I sub’d in fake numbers because you’ll have to buy me a beer to see the real dashboard). No coding. No fancy integrations. Just some simple drag and dropping and basic configuring that probably took me 30 minutes. We now have a dashboard that:
- Updates in real time (with a few metrics that I can manually feed in on a quarterly basis)
- Is something I can easily share with our team, stakeholders, and key company advisors
Interested in learning more? Drop me a line! tj@standardco.de

